Fruit detection
We present quantitative and qualitative results in this page. (WIP)
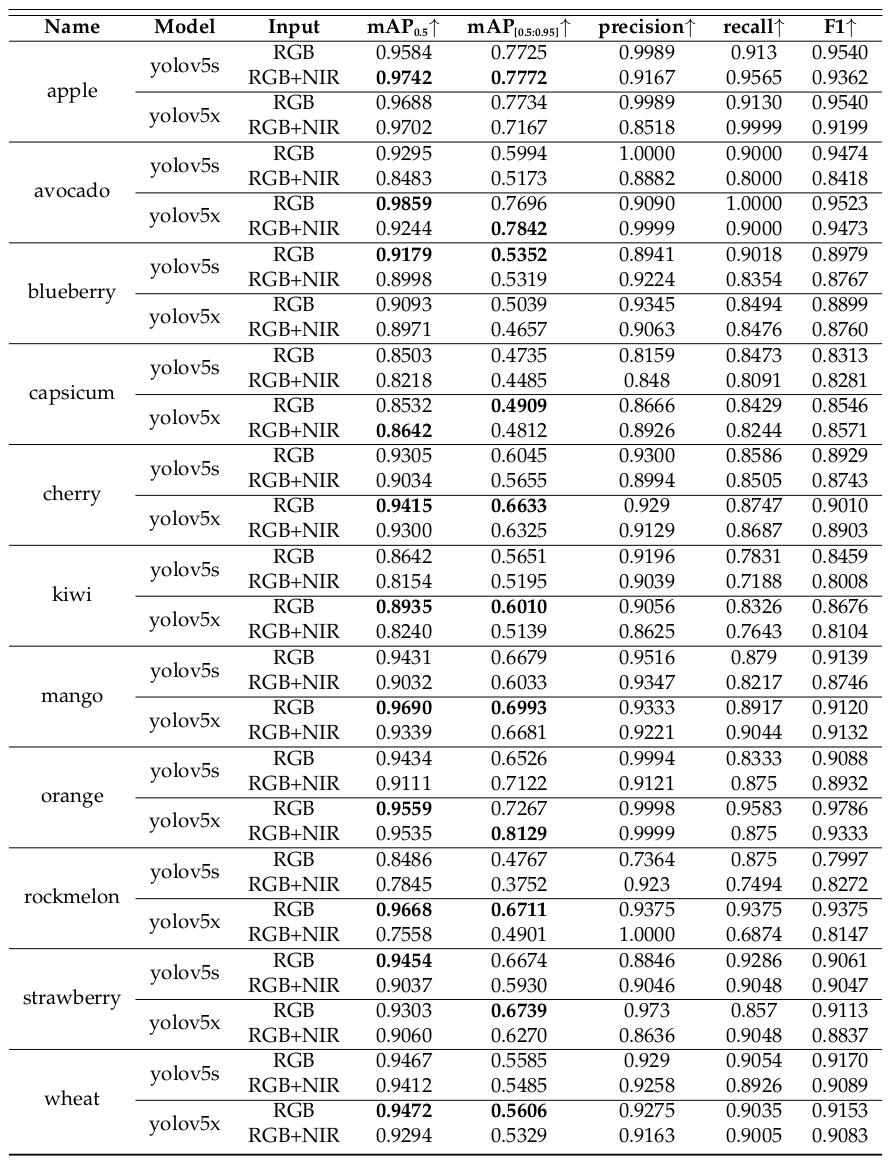
Quantitative results
11 fruits/crops object detection quantitative results table. Up-arrow indicates a higher score is better performance. Bold denotes the best performance in the corresponding metric within each fruit.
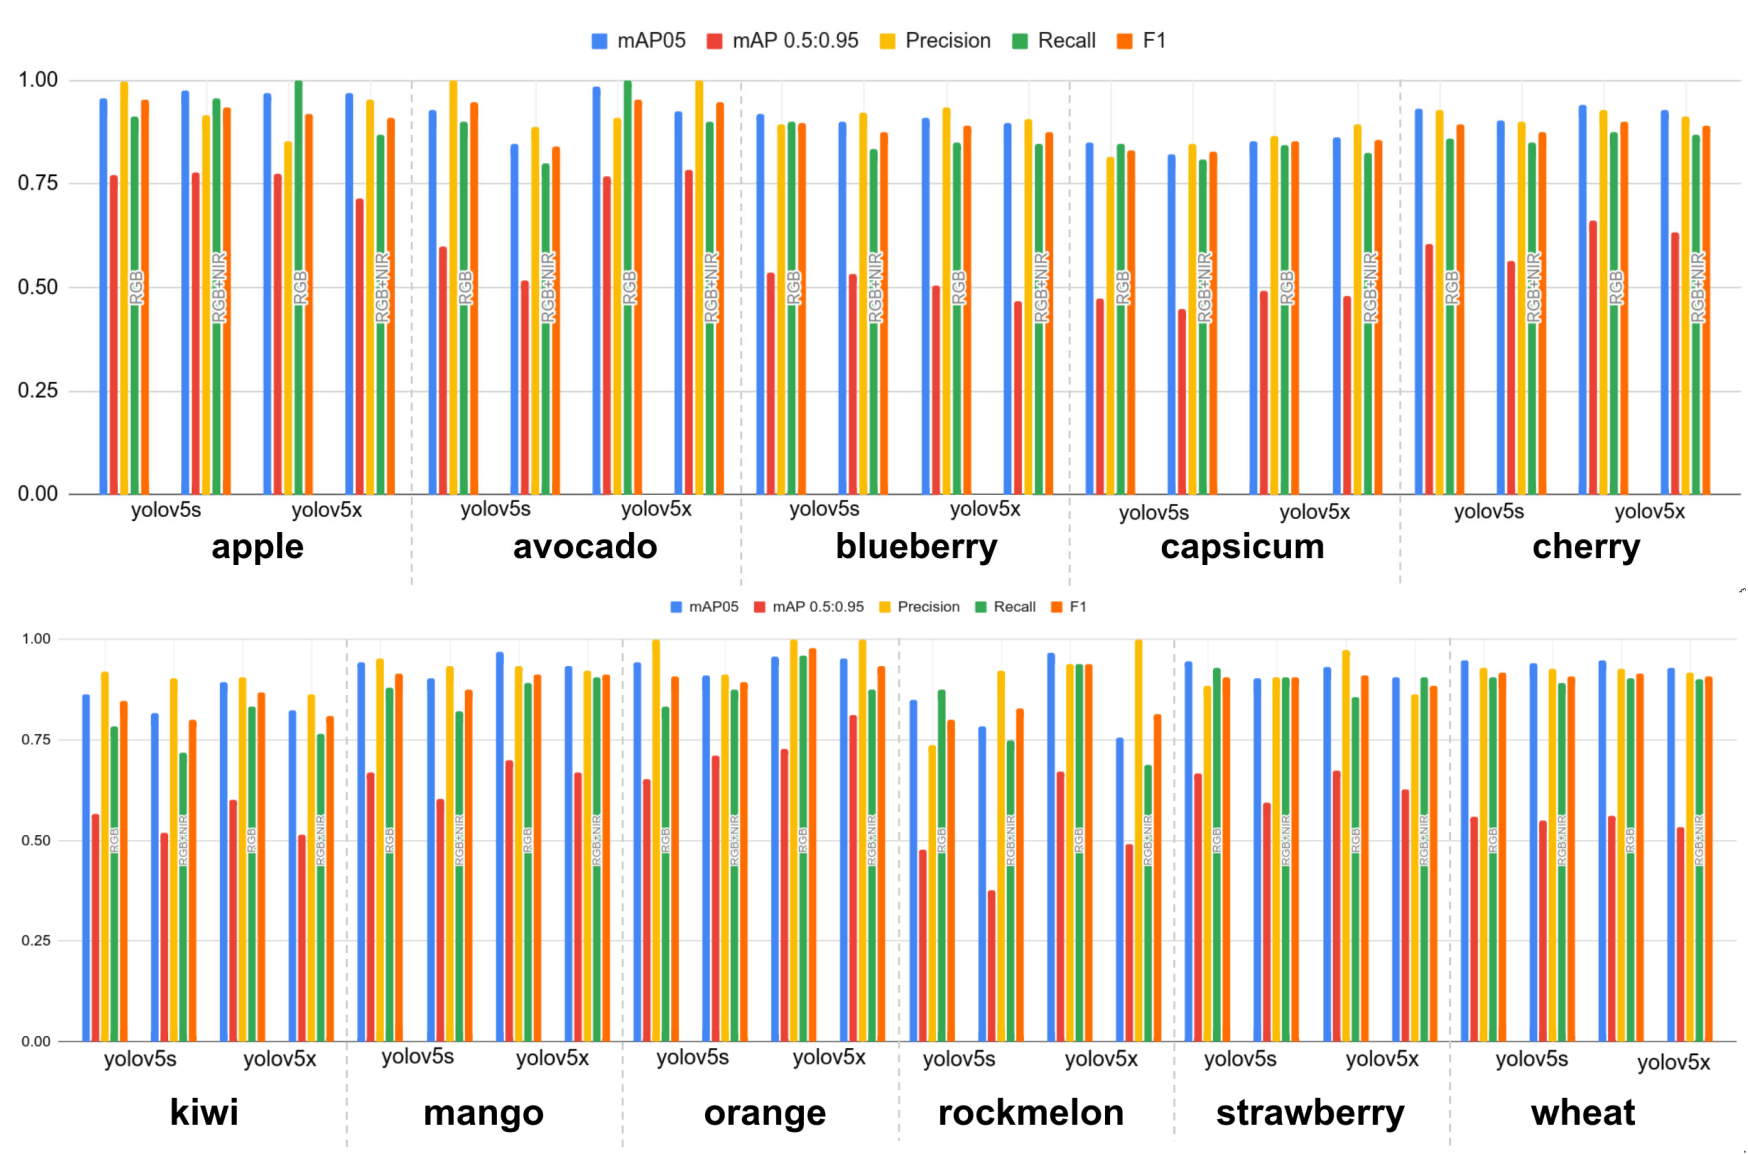
Object detection results summary. Different colours indicate the corresponding metrics. The different type of input data (i.e., RGB or RGB+NIR) are separately grouped for each yolov5 models.
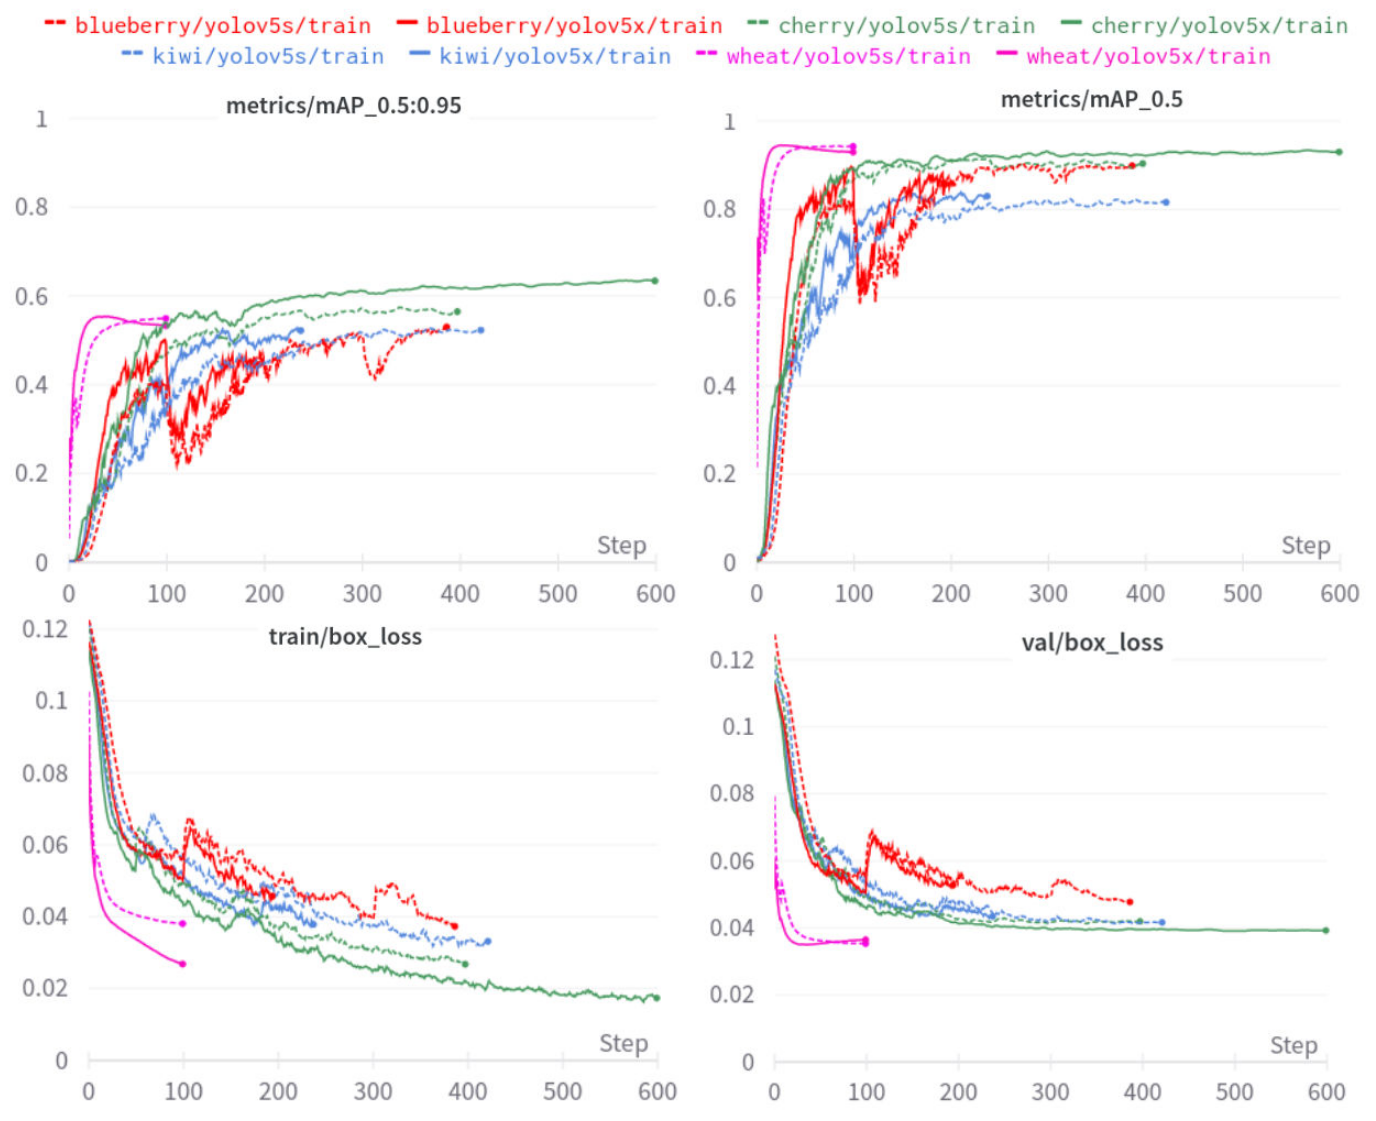
Loss curves
mAP performance metrics and train/validation bounding box loss plots for newly added 4 fruits/crops. Due to early-stopping mechanism, each experiment has a varying step length but it should have the same length for its metric and loss.
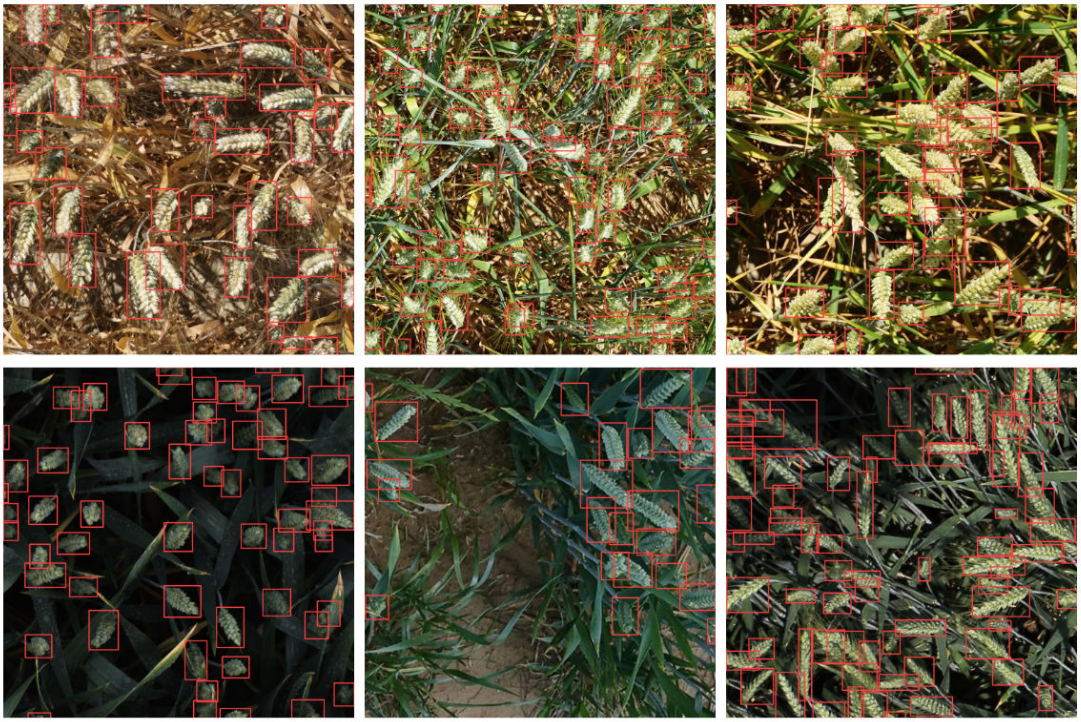
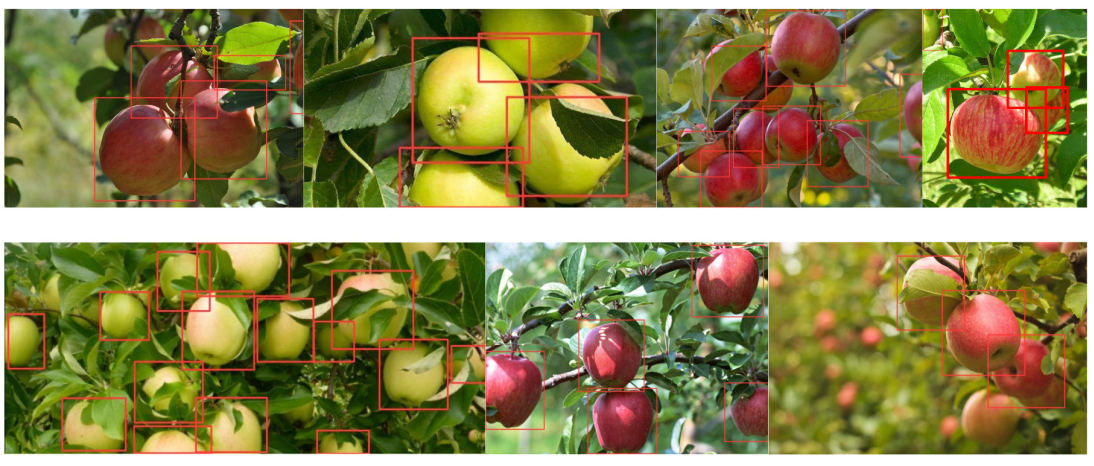
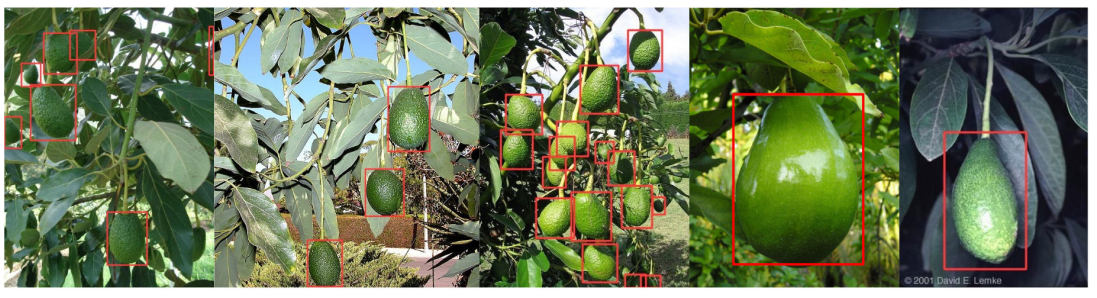
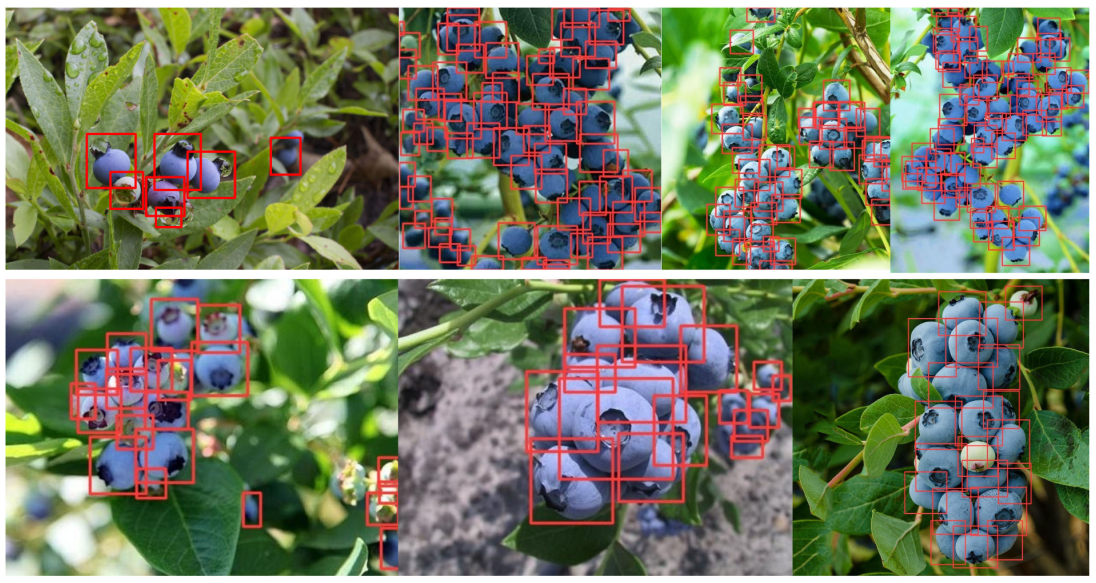
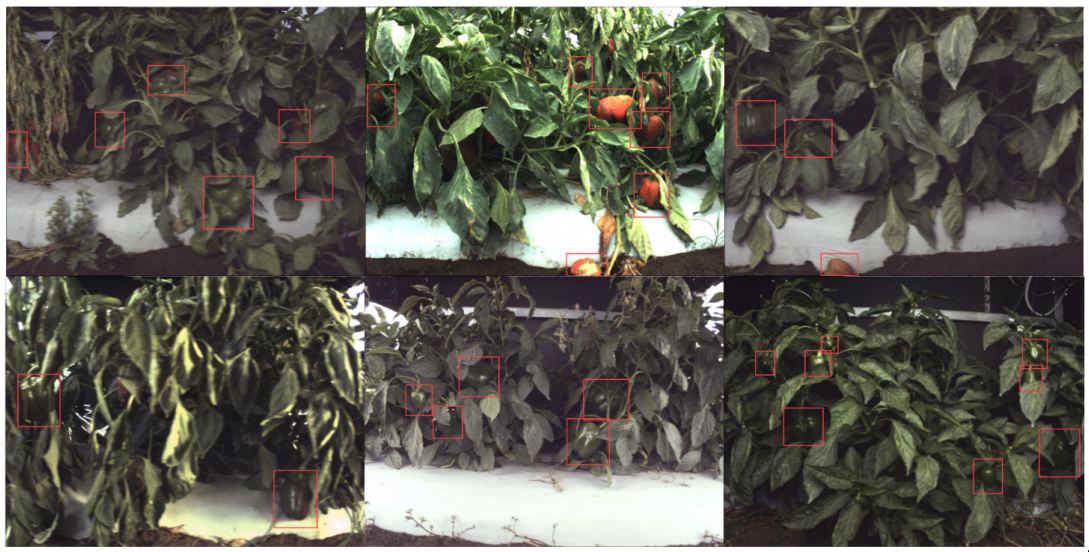
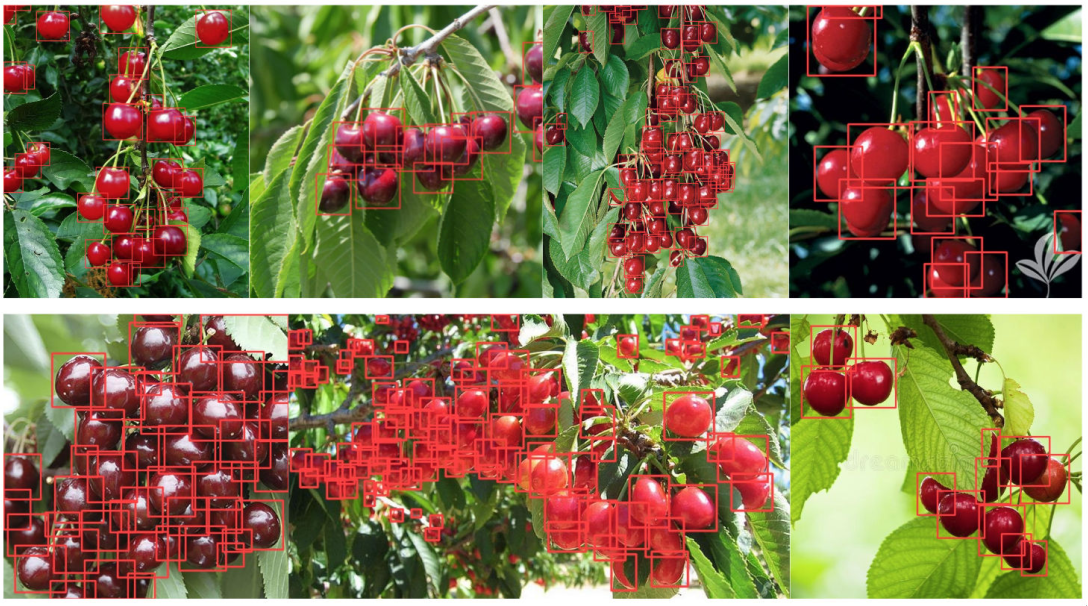
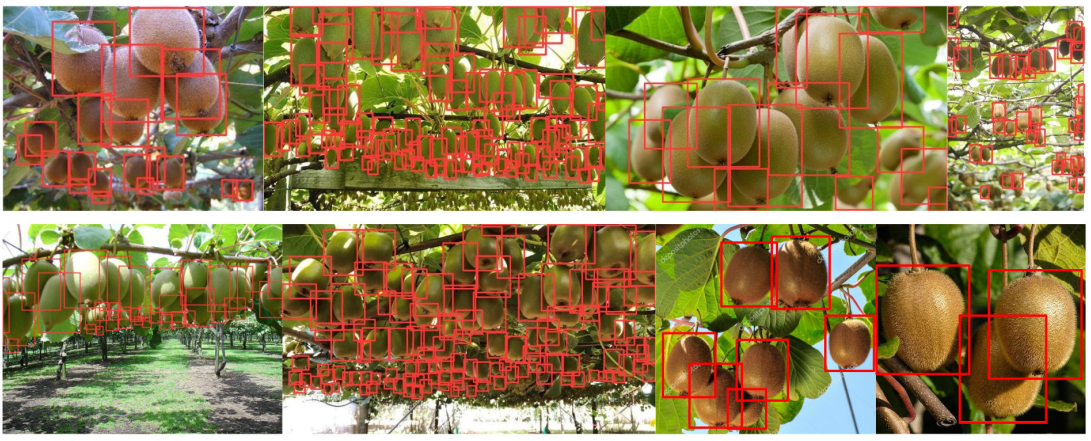
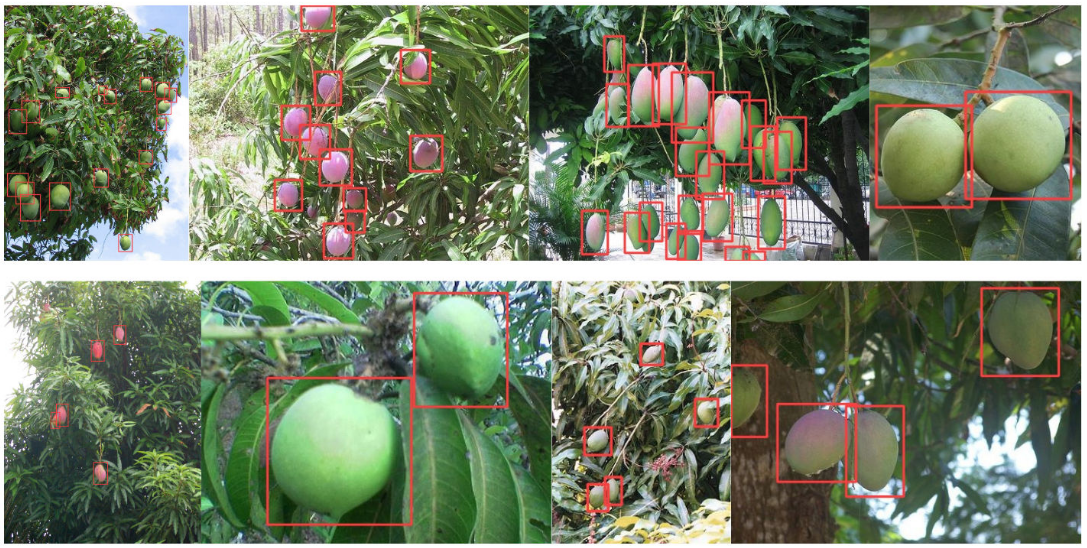
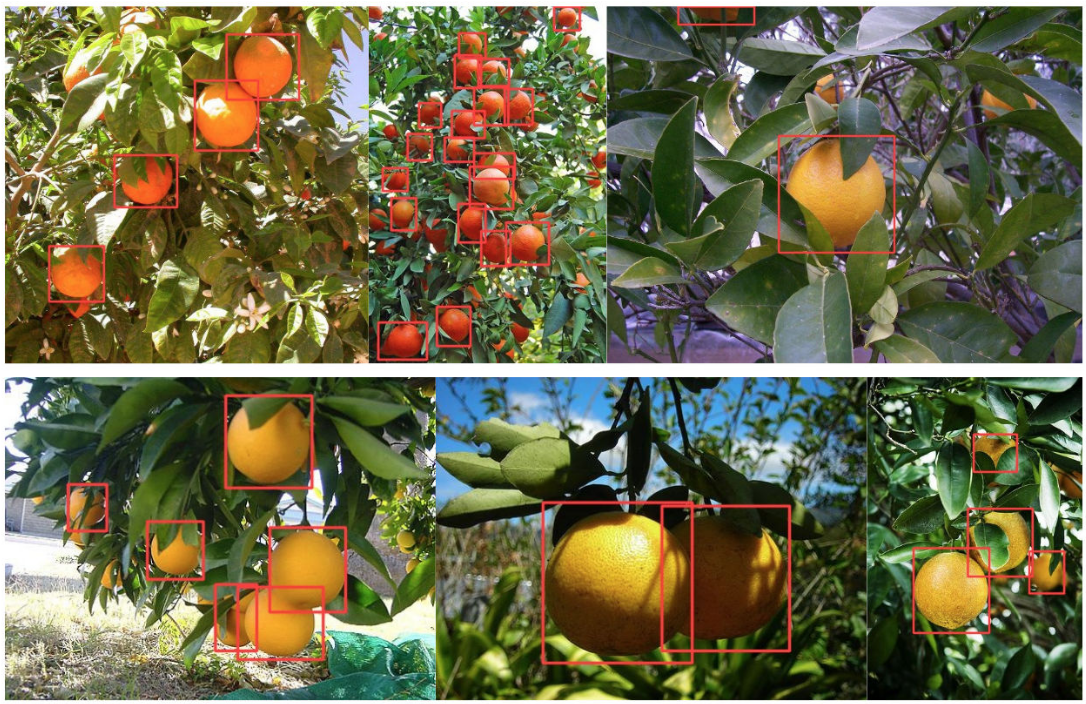
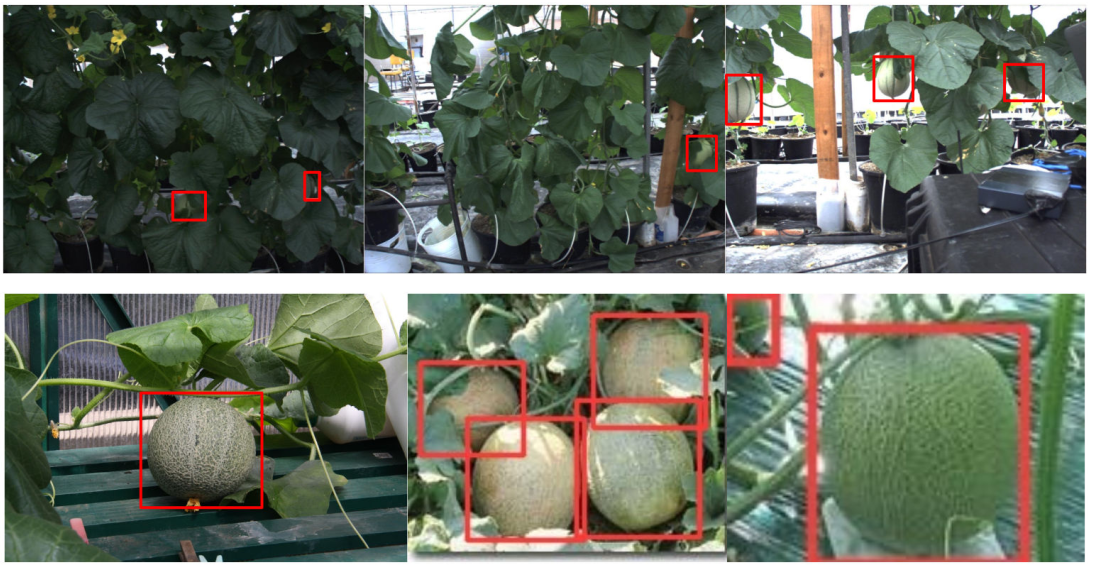
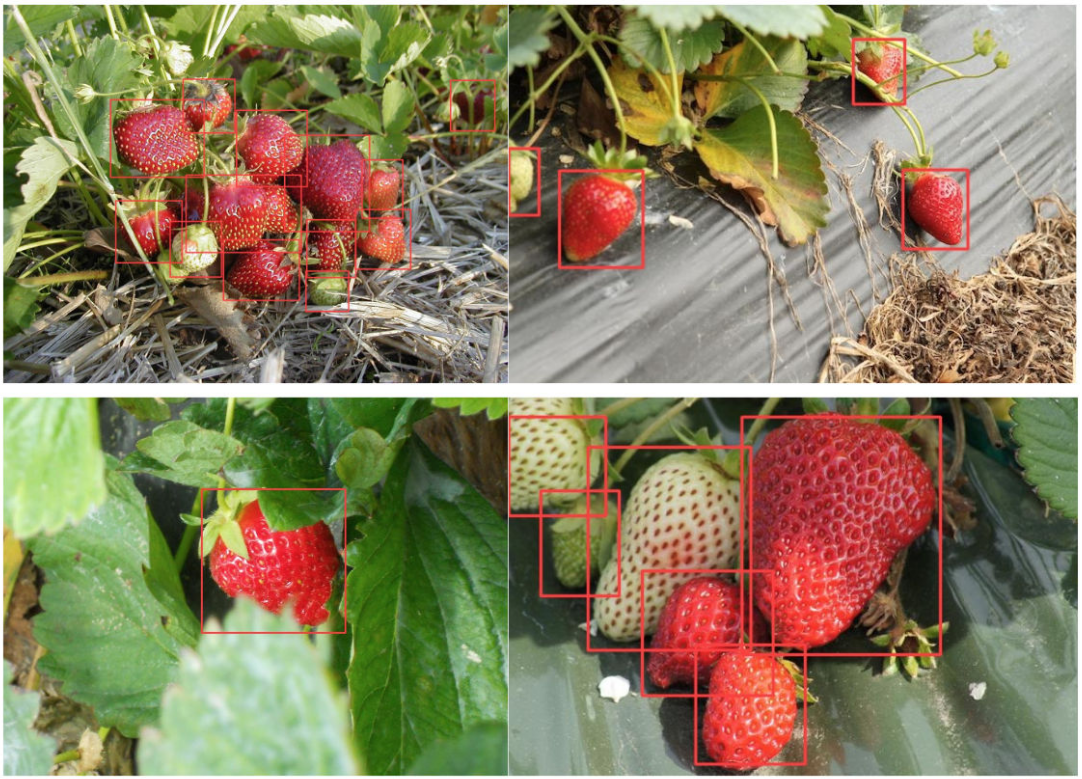
Qualitative results
11 fruits/crops prediction results using Yolov5x and RGB test images. Images are obtained from deepFruits1 and Google Images.
 Apple
Apple
 Avocado
 Blueberry
 Capsicum
 Cherry
 Kiwi
Kiwi
 Mango
Mango
 Orange
 Rockmelon
 Strawberry
Wheat